Pempro Fun & Games
PEC with Fundamentals Applied
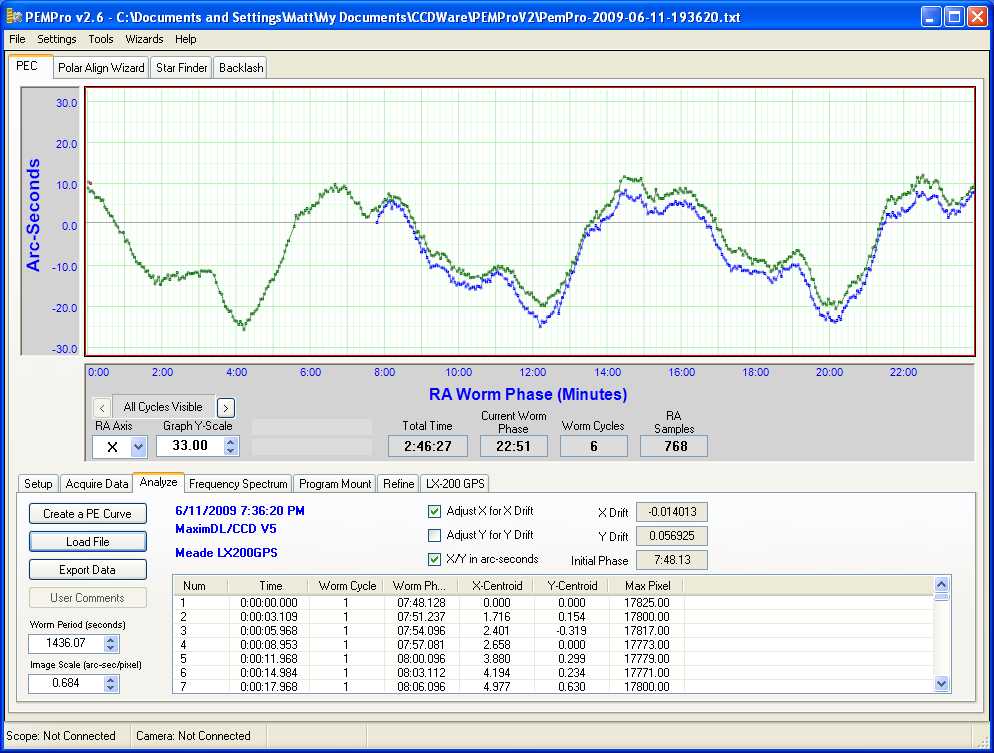
I started my second attempt of PEC refinement by again turning the PEC off on my LX200GPS. From the results below, you can see similar results to that previously shown with a natural PE of about 35 arc seconds. You can also see that this time around, I let the PE measurement run for a longer period of time (40 minutes in total).
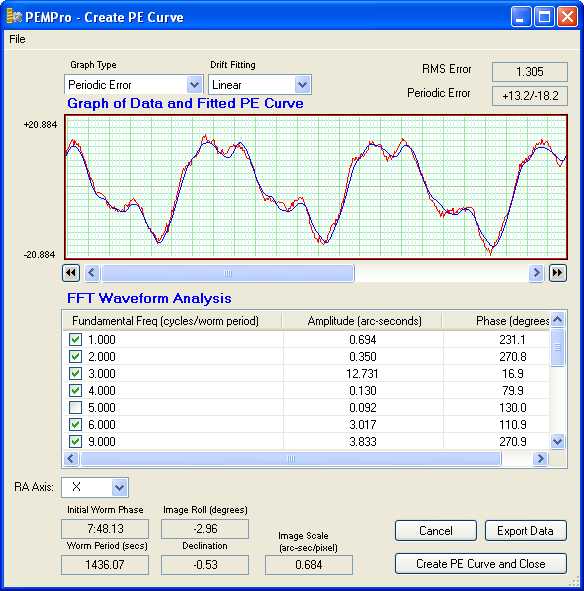
After clicking on the Create PE Curve button, Pempro created the basic curve shown below. You can see that with no modifications, the RMS Error is 1,305.
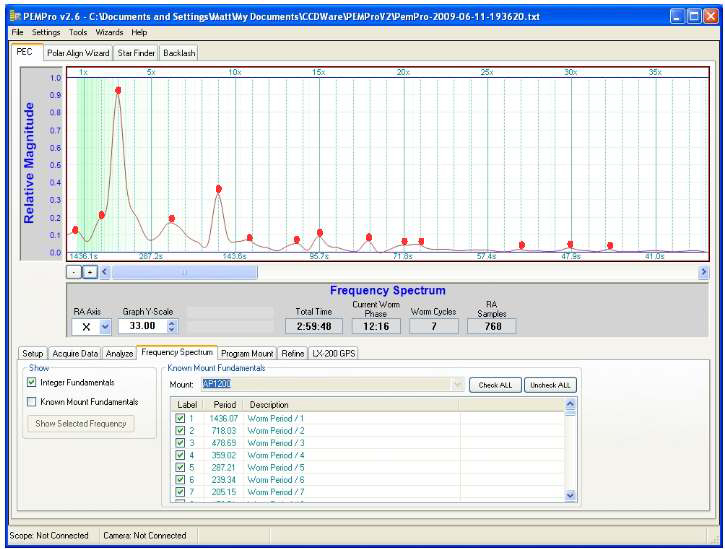
This time, instead of just finding the best Drift Filter, I decided to analyse the fundamentals of the curve and edit the fundamentals table. To do this, I closed the Create PE Curve window and clicked on the Frequency Spectrum Tab. The aim here is to identify all of the significant peaks in the graph and enter their values into the fundamentals table. Each of these peaks represents an identified repeatable characteristic of the PE curve. For example, you can see that the most significant peak corresponds to 3x (3 times). This means that Pempro has identified a repeatable curve characteristic that occurs 3 times per PE cycle. This makes good sense as with the LX200GPS, one PE cycle corresponds to 3 turns of the worm.
The values I noted are 0.5, 2, 3, 6, 9, 10.6, 13.5, 15, 18, 20, 21, 27, 30 & 32.
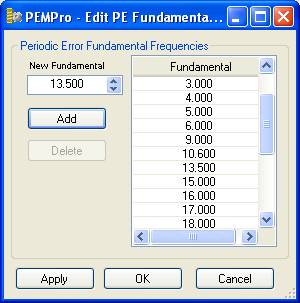
I returned to the Analyse Tab and clicked on the Create PE Curve button again. I then clicked on file, Edit Fundamentals and added all of the values that I noted above (if they didn't already exist). I also found that leaving the existing values in place seemed to improve the result, even if they did not appear on the fundamentals graph. Clicking on OK returned me to the Create PE Curve window.
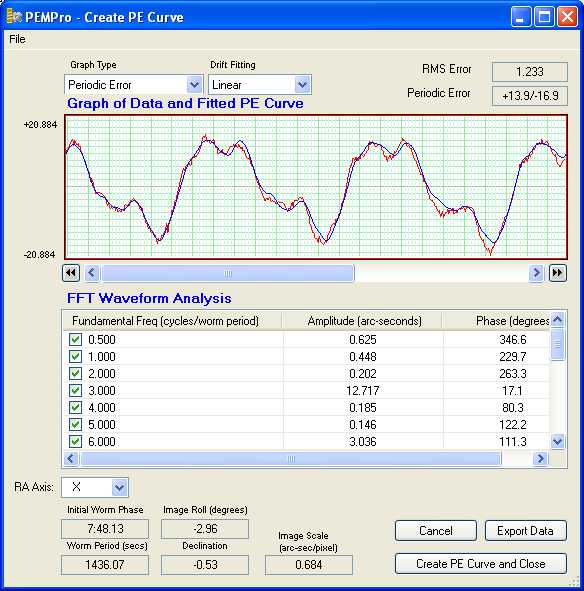
You can see below that the RMS error had dropped from 1305 to 1233. I then tried applying different Drift Fitting values until I found the optimal one which turned out to be bicubic. This got the RMS Error down to 1088. I then clicked on teh Create PE Curve and Close button.
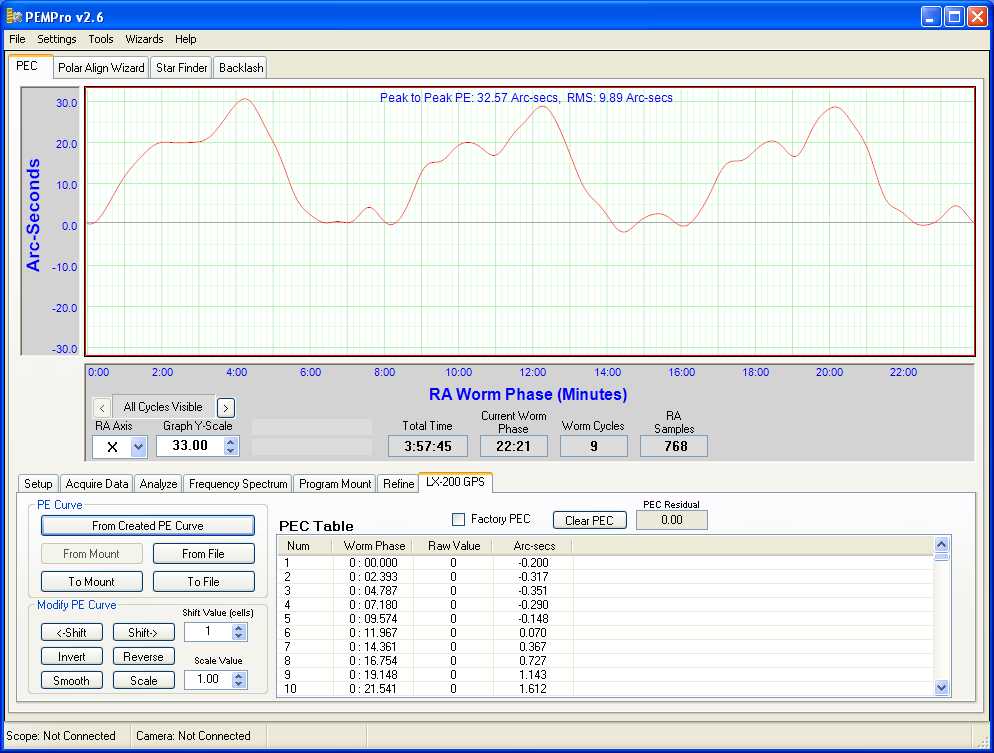
I clicked on the LX200 GPS Tab and imported the curve onto the screen by pressing the "From Created PE Curve" button and then uploaded the new PEC curve to my mount by pressing the "To Mount" button.
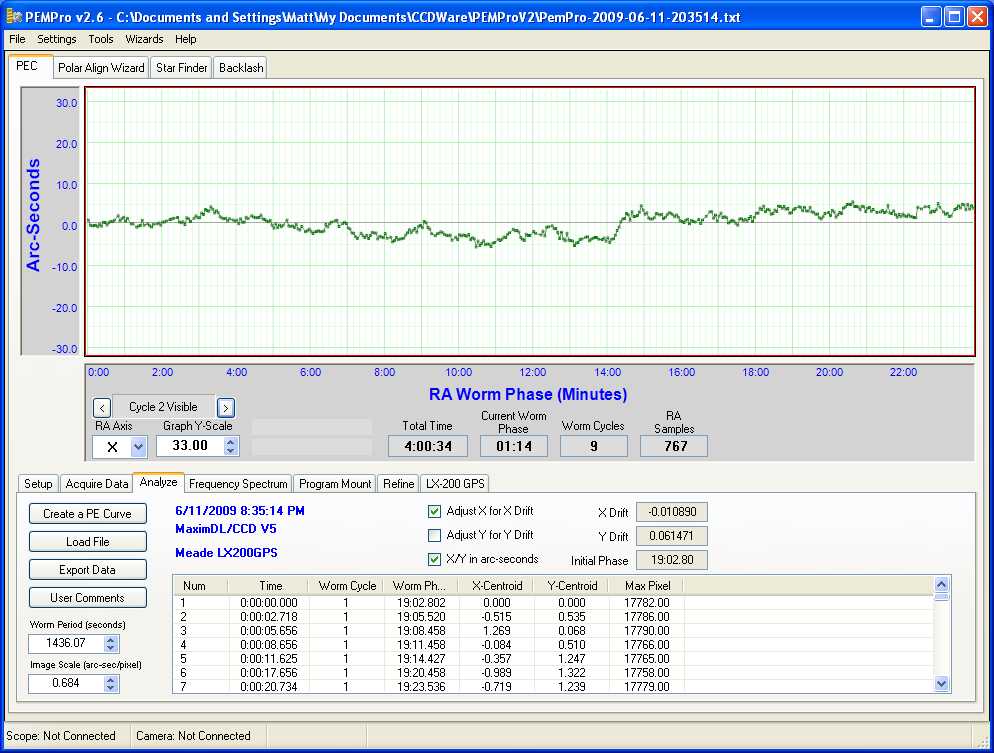
In order to determine the residual PE with the new PEC curve applied, I then performed another PE measurement, this time with the RA PEC turned on in my mount. As you can see below, it appears to have reduce the PE to ~11 arc seconds. A huge improvement on my previous attempt!!
I then ran through the process of inspecting the Frequency Spectrum to determine the fundamentals of this new curve and using them to create and apply a new curve. This time around, I managed to get the RMS Error down from 1157 to 1098 by using 5th OrderBicubic as the Drift Fitting number.
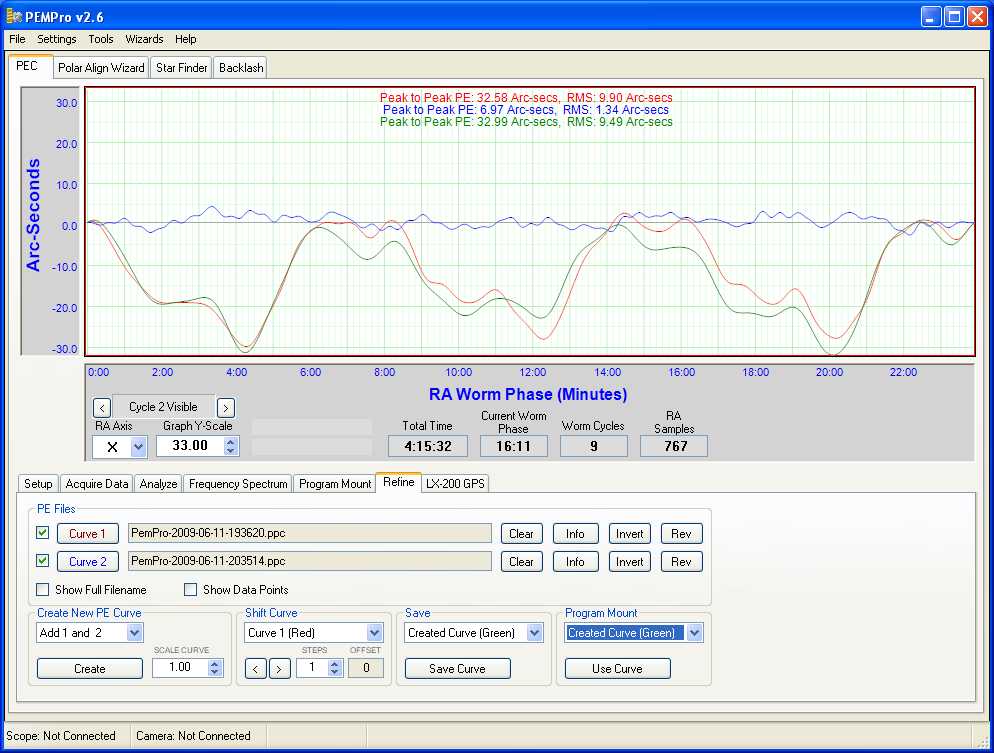
As I did in my first attempt, switched to the Refine Tab and loaded the initial curve (Curve 1 - red) and the residual curve (Curve 2 - blue) and selected Add 1 and 2 from the Create new PE Curve box. Pressing the Create button created the new curve (Curve 3 - green). I then saved this new curve and pressed the Use Curve button to place it in memory. I then changed to the LX-200 GPS Tab and imported the new PEC Curve by pressing the From Created PE Curve button and then wrote it to the mount.
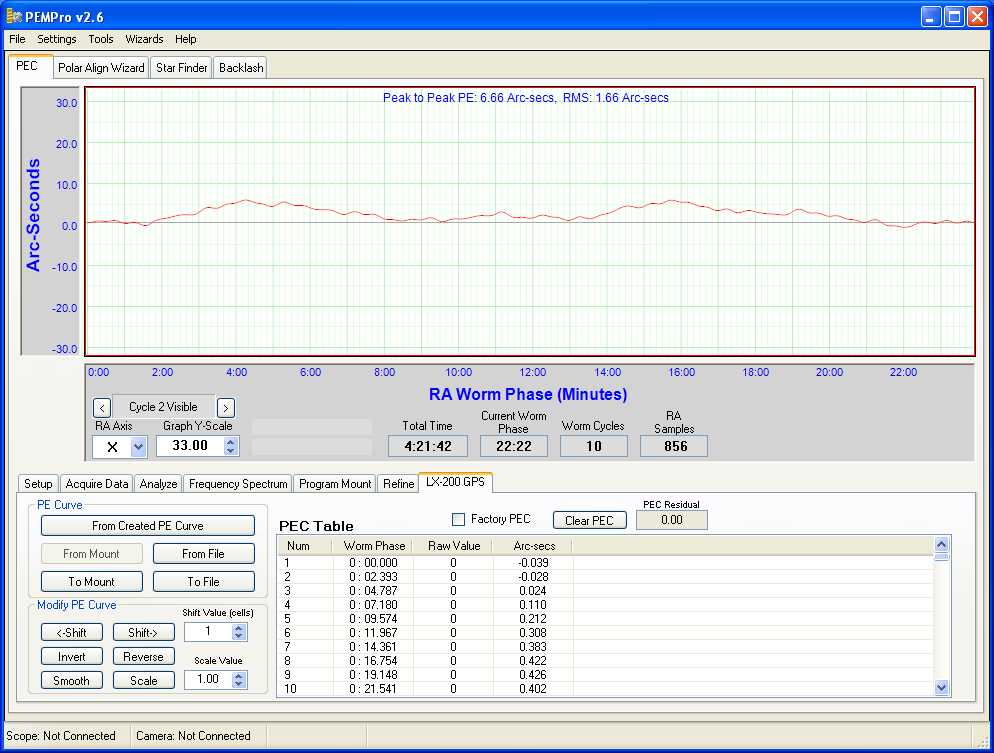
I then measured the PE of my mount with the new combined PEC Curve in action. As you can see below, the PE with this curve loaded is now about 6.6 arc seconds. Just what I was looking for!!!!!
